Profit and Loss Statement Summary
| (millions of yen) | FY2020 | FY2021 | FY2022 | FY2023 | FY2024 |
|---|---|---|---|---|---|
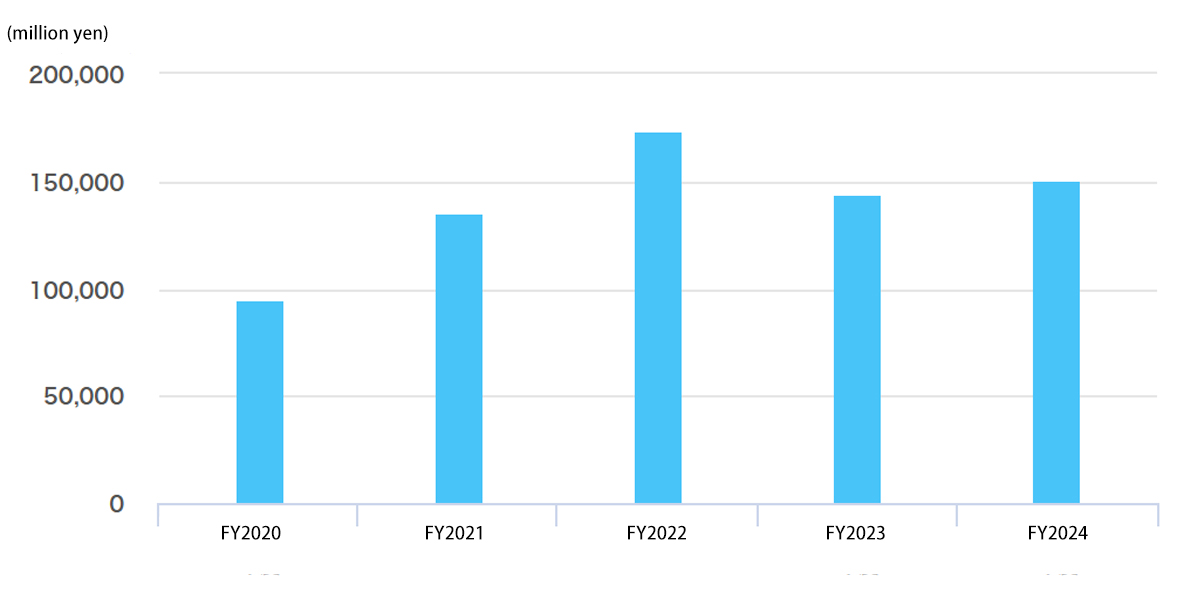
| Orders Received | 94,563 | 135,698 | 173,491 | 144,468 | 151,272 |
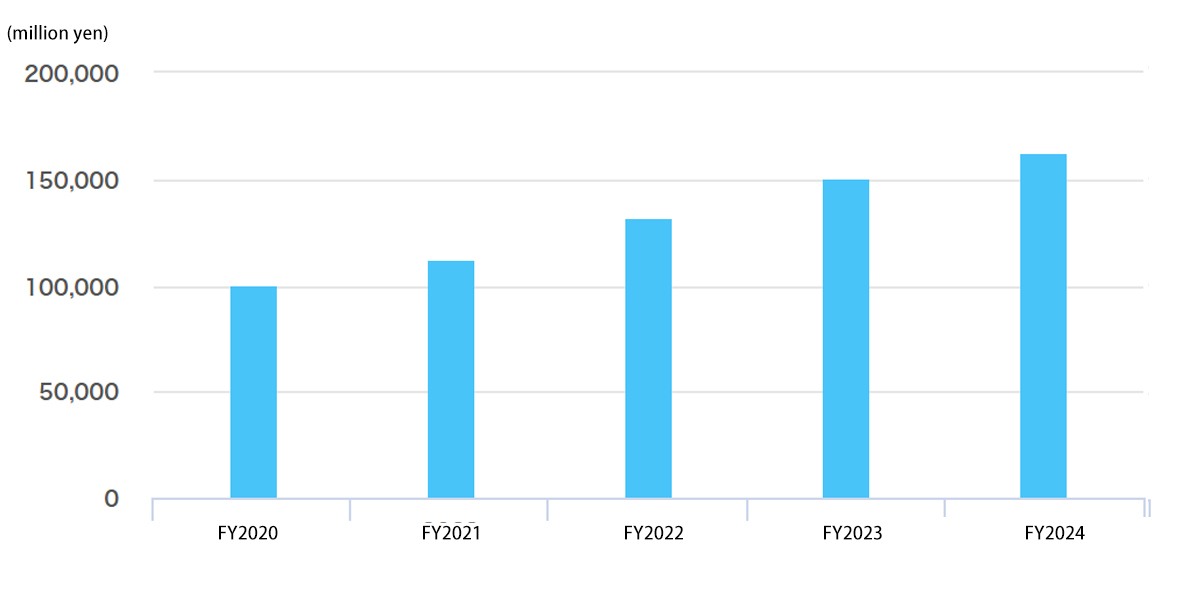
| Net Sales | 100,638 | 112,069 | 132,426 | 150,356 | 163,269 |
| Gross Profit | 26,326 | 28,512 | 34,976 | 43,841 | 55,182 |
| Gross Profit Margin (%) | 26.2 | 25.4 | 26.4 | 29.2 | 33.8 |
| Selling, General and Administrative Expenses (SGA) | 16,746 | 17,662 | 19,763 | 21,297 | 24,061 |
| Operating Income | 9,579 | 10,850 | 15,212 | 22,544 | 31,120 |
| Operating Income Ratio (%) | 9.5 | 9.7 | 11.5 | 15.0 | 19.1 |
| Ordinary Income | 9,900 | 11,545 | 16,020 | 23,425 | 31,639 |
| Ordinary Income Ratio (%) | 9.8 | 10.3 | 12.1 | 15.6 | 19.4 |
| Net Income | 7,074 | 9,210 | 11,730 | 17,310 | 24,150 |
| Net Income Ratio (%) | 7.0 | 8.2 | 8.9 | 11.5 | 14.8 |
Financial Data
| (millions of yen) | FY2020 | FY2021 | FY2022 | FY2023 | FY2024 |
|---|---|---|---|---|---|
| Net Assets | 67,357 | 76,004 | 86,371 | 102,147 | 121,194 |
| Total Assets | 115,011 | 130,506 | 164,854 | 182,703 | 194,396 |
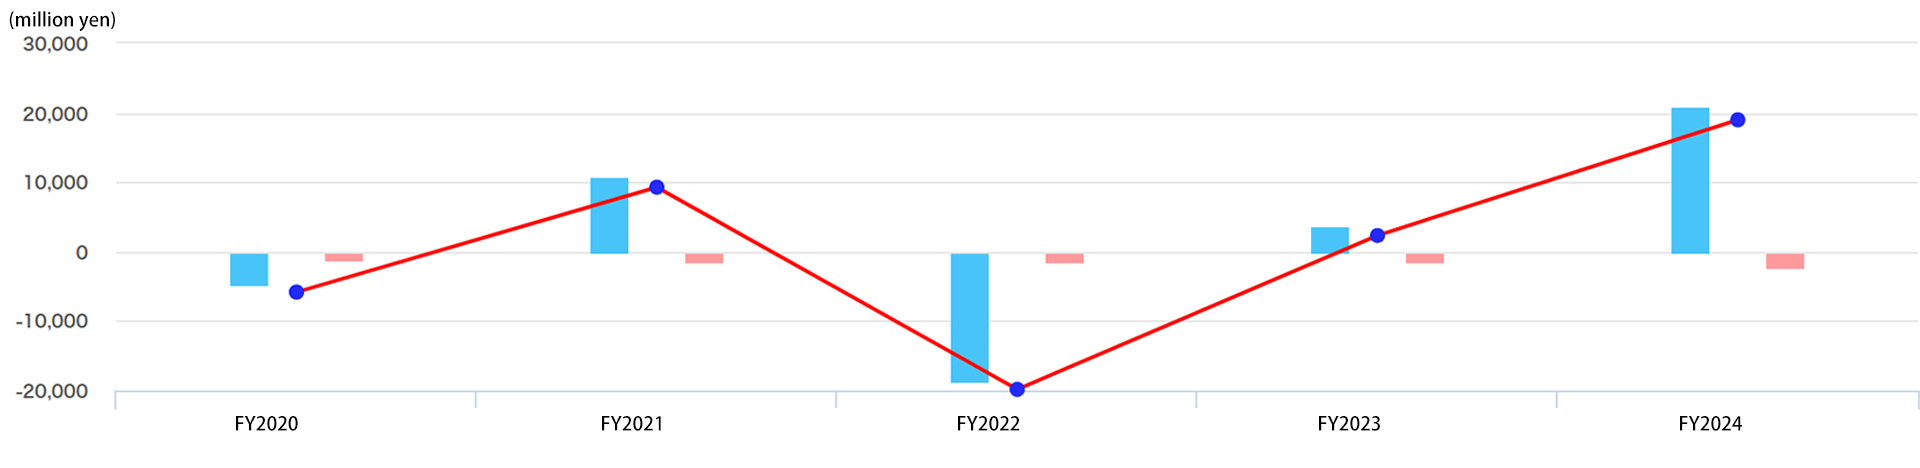
| Cash Flow from Operating Activities | -4,582 | 10,787 | -18,536 | 3,726 | 21,100 |
| Cash Flow from Investing Activities | -1,261 | -1,520 | -1,309 | -1,415 | -2,130 |
| Cash Flow from Financing Activities | 4,927 | -2,586 | 14,706 | -641 | -20,821 |
| Free Cash Flow | -5,843 | 9,267 | -19,845 | 2,311 | 18,970 |
| Capital Expenditures | 1,015 | 3,387 | 1,466 | 1,855 | 2,803 |
| R&D Expenses | 2,300 | 2,146 | 2,615 | 2,829 | 3,253 |
| Depreciation | 1,212 | 1,332 | 1,824 | 2,010 | 1,925 |
| Liabilities with Interest | 16,005 | 15,628 | 33,019 | 36,465 | 22,557 |
| Dividend (yen) | 28.50 | 40.00 | – | 102.00 | 160.00 |
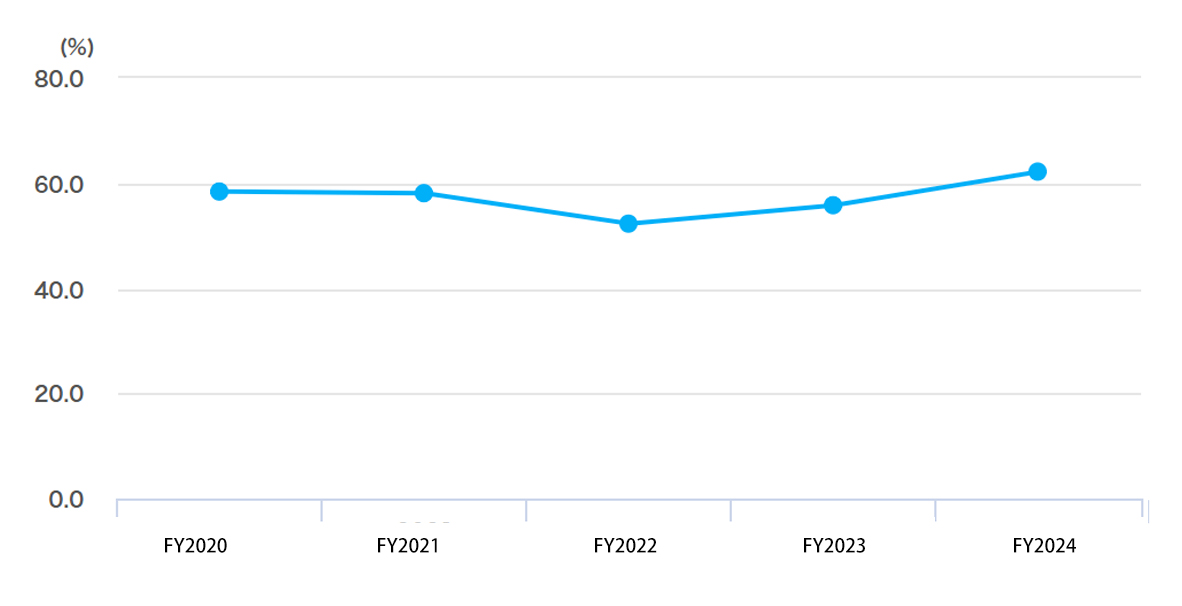
| Total Shareholders’ Equity Ratio (%) | 58.4 | 58.1 | 52.3 | 55.8 | 62.2 |
| Book-value Per Share (BPS) | 1,464.1 | 1,655.1 | 1,877.8 | 2,218.5 | 2,631.2 |
| Earnings Per Share (EPS) (yen) | 154.2 | 200.7 | 255.8 | 376.9 | 525.4 |
| Return on Equity (ROE) (%) | 11.1 | 12.9 | 14.5 | 18.4 | 21.7 |
| Return on Asset (ROA) (%) | 9.1 | 9.4 | 10.8 | 13.5 | 16.8 |
※The Company implemented a 4-for-1 share split of common shares on October 1, 2022.Book-value Per Share (BPS), Earnings Per Share (EPS), and Dividend before FY2022 are amounts that take into account the share split.
Balance Sheet Summary
| (millions of yen) | FY2020 | FY2021 | FY2022 | FY2023 | FY2024 | ||
|---|---|---|---|---|---|---|---|
| Assets | Current Assets | Cash | 12,804 | 20,198 | 15,558 | 17,642 | 16,751 |
| Trade Notes and Accounts | 49,517 | 27,342 | 40,433 | 44,121 | 43,226 | ||
| Inventories | 12,876 | 13,455 | 30,795 | 21,830 | 22,524 | ||
| Others | 14,505 | 41,867 | 49,979 | 69,876 | 81,866 | ||
| Total Current Assets | 89,702 | 102,862 | 136,765 | 153,469 | 164,367 | ||
| Fixed Assets | Tangible Fixed Assets | 18,974 | 20,995 | 20,795 | 20,634 | 21,516 | |
| Assets | 1,105 | 1,082 | 949 | 986 | 1,120 | ||
| Investments and Other Assets | 5,228 | 5,566 | 6,343 | 7,613 | 7,391 | ||
| Total Fixed Assets | 25,308 | 27,644 | 28,088 | 29,233 | 30,028 | ||
| Total Assets | 115,011 | 130,506 | 164,854 | 182,703 | 194,396 | ||
| (millions of yen) | FY2020 | FY2021 | FY2022 | FY2023 | FY2024 | ||
|---|---|---|---|---|---|---|---|
| Liabilities | Current Liabilities | Trade Notes and Accounts Payable | 13,556 | 18,795 | 20,904 | 19,842 | 23,438 |
| Short-term Borrowings | 14,510 | 9,933 | 29,124 | 34,065 | 18,877 | ||
| Others | 12,683 | 14,344 | 18,710 | 18,695 | 22,086 | ||
| Total Current Liabilities | 40,749 | 43,072 | 68,738 | 72,602 | 64,401 | ||
| Long-term Liabilities | Long-term Borrowings | 1,495 | 5,695 | 3,895 | 2,400 | 3,680 | |
| Others | 5,410 | 5,734 | 5,849 | 5,553 | 5,119 | ||
| Total Long-term Liabilities | 6,905 | 11,429 | 9,744 | 7,953 | 8,799 | ||
| Total Liabilities | 47,654 | 54,501 | 78,483 | 80,555 | 73,201 | ||
| Net Assets | Shareholders’ Equity | 67,139 | 74,617 | 84,123 | 98,122 | 115,969 | |
| Valuation and Translation Adjustments | 74 | 1,218 | 2,047 | 3,805 | 4,978 | ||
| Minority Interests | 143 | 168 | 201 | 219 | 246 | ||
| Total Net Assets | 67,357 | 76,004 | 86,371 | 102,147 | 121,194 | ||
| Total Liabilities and Net Assets | 115,011 | 130,506 | 164,854 | 182,703 | 194,396 | ||
-
- Orders Received
-
■Orders Received
-
- Net Sales
-
■Net Sales
-
- Operating Profit Margin and Net Profit Margin
-
●Operating Profit Margin
■Net profit margin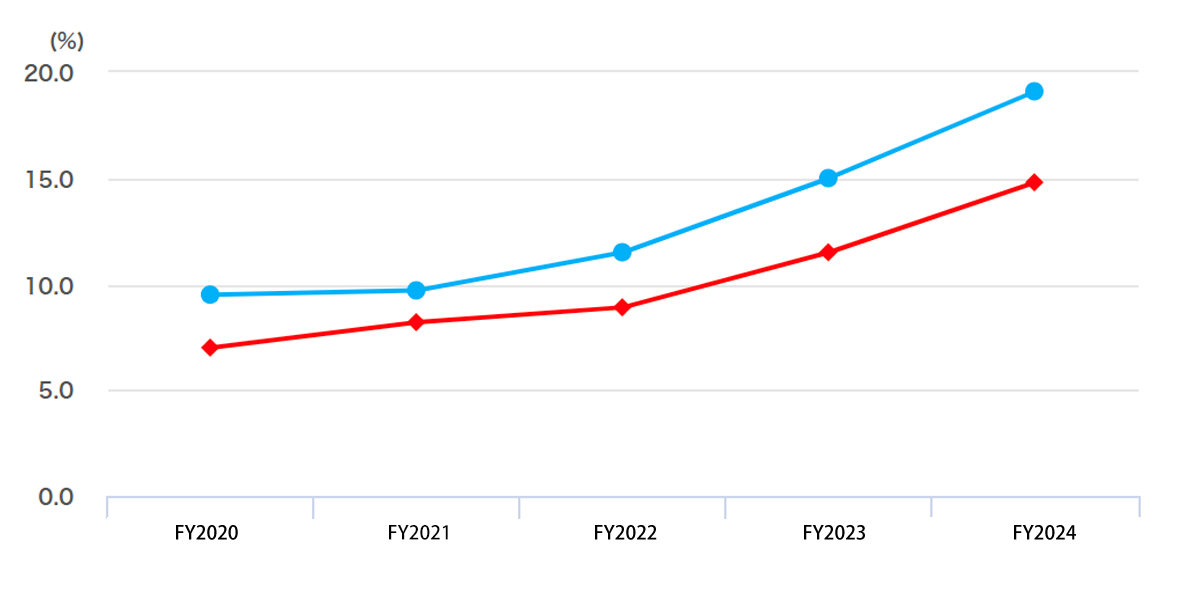
-
- ROE、ROA
-
●ROE
■ROA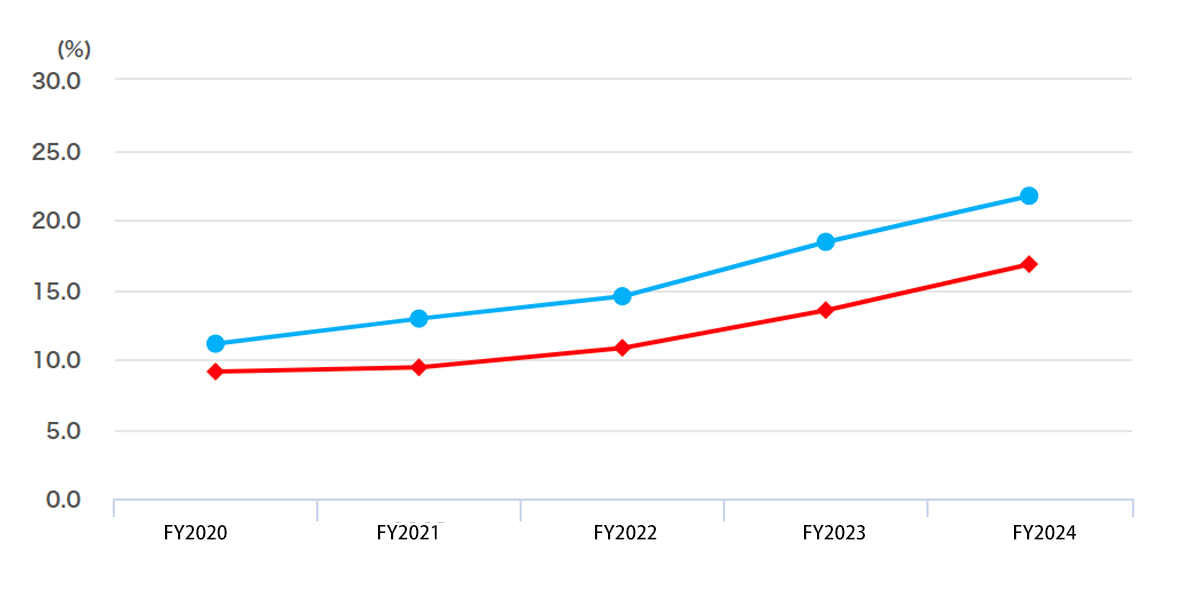
-
- Equity Ratio
-
●Equity Ratio
-
- Free Cash Flow
-
■Cash Flow from Operating Activities
■Cash Flow from Investing Activities
●Free Cash FFlow